Experiments were conducted in a vertical growing system on two lettuce varieties (Red Oakleaf and Green Butter Salanova) under three different light treatments – fluorescent T5 lighting, Illumitex F3 LED spectrum, and Illumitex X5 LED spectrum. Light intensity levels were matched for the three light treatments and all other environmental parameters (media, temperature, pH) were constant. Due to differences in spectrums, the weight of the lettuce plants, as well as the taste and feel, differed between the treatments. The results of this study show that with identical photon flux between light treatments, LEDs provide more “usable” photons while using significantly less energy to operate.
Introduction
The experiment described in this report can be compared to previously published experimental results using the same system. In a previous experiment, labeled “Experiment 1,” the watts were held constant between the light treatments; whereas in the experiment described in this report, “Experiment 2,” the photosynthetic photon flux density (PPFD, light intensity) was held constant. The red lettuce variety in the previous experiment, “Experiment 1,” was conducted with Salanova red oakleaf, which was also used in the current experiment. The results outlined in this report enhance previous in-house experimental data showing the benefits for LEDs in indoor farming for both operating cost savings as well as improved plant productivity. Additional reports and supplemental material are available from references [1-3].
Objective
To compare the effects of fluorescent lighting to two Illumitex Surexi power bar spectrums (F3 and X5) on growth of Salanova Lettuce (green butter and red oakleaf) with matching light intensity levels.
Materials
Please refer to previous reports on the experimental system setup, the lighting materials, and the seeds and consumables [1,2].
Methods
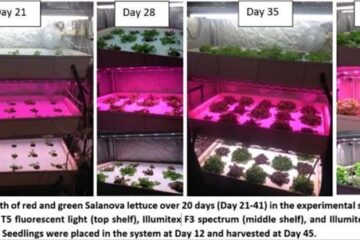
Seeds were germinated in plugs in a humidity dome at 75 °F under an Eclipse Gen2 F3 spectrum at 250 µmol/m2-s, 24 hr light for 14 days before being transferred to the experimental setup. The experimental setup was a three-tiered, recirculated, gravity-feed, hydroponic, deep-raft system inside a grow tent with three different light treatments (one on each shelf). The intensity of the LED lights on the middle shelf (F3 spectrum) and bottom shelf (X5 spectrum) were adjusted until they matched the light output of the fluorescent lights (top shelf) using a LICOR-250A light meter.
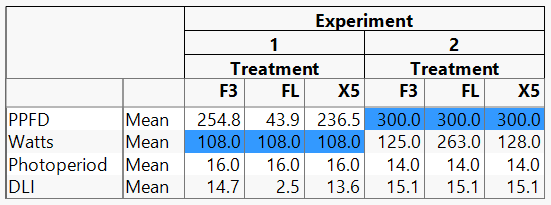
Table 1 shows the PPFD levels (µmol/m2-s), watts, photoperiod (hr), and daily light integral (DLI) (mol/m2) for the different treatments and experiments. The type of condition kept constant is highlighted in each experiment. Experiment 1 watts were equal in the three treatments but the PPFD values were different due to differences in the efficiency for electricity to photon conversion. Experiment 2 PPFD was constant but the watt consumption was higher for FL because the electricity consumption must increase for FL lights to match the intensity of LED lights.
Another difference between the experiments to note is the difference in photoperiod. In Experiment 1 the lights were on daily for a 16 hr photoperiod. In Experiment 2, additional FL lights were added to meet the light intensity requirements. Since FL lights cannot be adjusted, the LED lights had to increase in intensity to match the FL lights.
DLI is the amount of light plants received daily and is a function of light intensity and photoperiod. In order to better match the amount of daily light for both experiments, Experiment 2 photoperiod was decreased to 14 hr. This resulted in a DLI of 15.1 for Experiment 2. In Experiment 1 the DLI was much lower for the FL because the PPFD was much lower for FL compared to LED.
Table 1 – Specifications of the three experimental light treatments
Taste-testing was conducted in-house by volunteers. Each participant was given a random number which correlated to either red or green lettuce varieties with each of the three light treatment-grown lettuces, with the three treatments randomly given labels “1” “2” or “3” – the numbers corresponding to different treatments. The participants filled out a questionnaire (Appendix A) and were encouraged to leave descriptive comments.
Results
Experiment 2 Weight Results
Results for Experiment 1 (with constant wattage) can be found in two previous reports [1,2]. For this experiment, Experiment 2 (constant PPFD), the weights for the green lettuce versus the red lettuce under the different treatments can be seen in Figure 1. Similar to Experiment 1, red and green lettuce grew best in LED light (green preferred X5 spectrum and red preferred F3 spectrum) followed by fluorescent light. Unlike in Experiment 1, the both red and green preferred F3 spectrum and the differences between LED and fluorescent were not as pronounced.
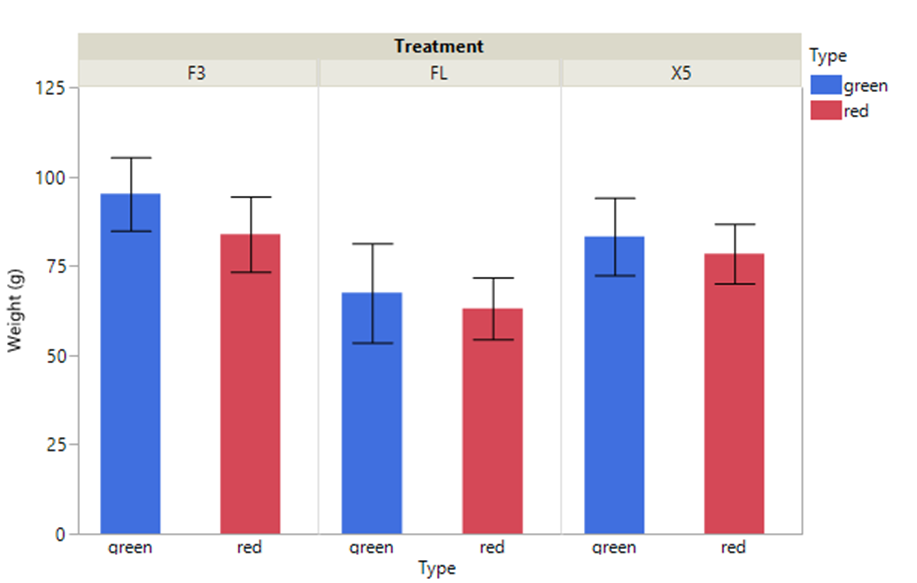
Figure 1 – Green lettuce and red lettuce weight data under different light treatments at the same light intensity (PPFD).
To test the significance of the differences, the Tukey’s test was used as a statistical measurement. Figure 2 shows that the differences in variability between the three light treatments for the green lettuce were similarly statistically different. Whereas, for red lettuce, the two different LED treatments performed more similarly than the fluorescent treatment.
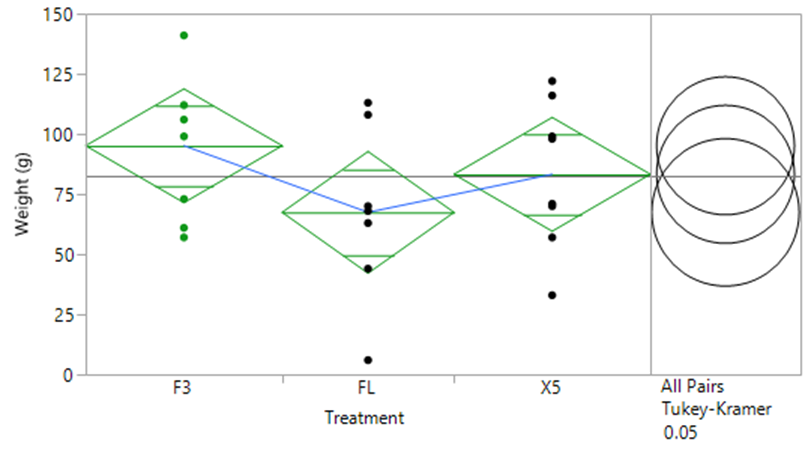
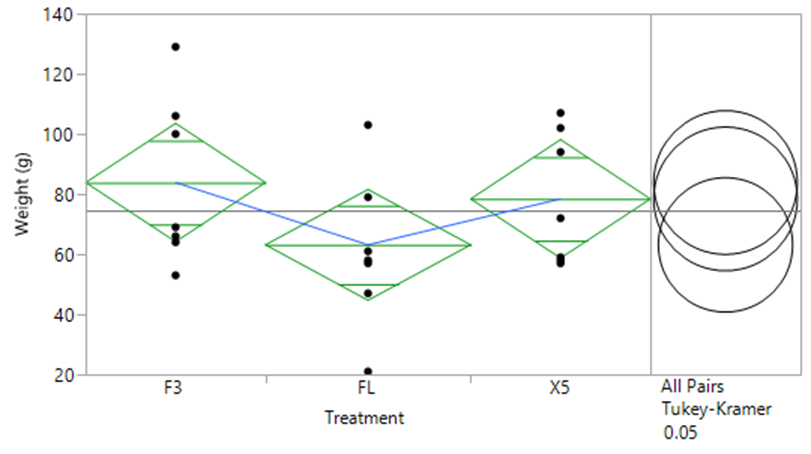
Figure 2 – Pairwise tests for green lettuce and red lettuce weight data.
Comparison of Experiment 1 and 2 Results
In Experiment 1 and 2, both lettuce varieties grew best under LED. There was a big difference in lighting level for Experiment 1 because the wattages were the same. The only difference in Experiment 2 lighting was in the spectrums, indicating that light quality is what caused the difference in growth. Figure 3 shows the weight results for both experiments by lettuce type and treatment in addition to several parameters (DLI, watts, PPFD) for reference.
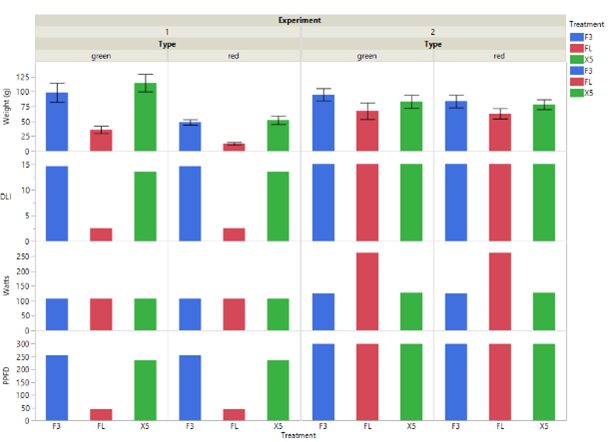
Figure 3 – Results of green lettuce and red lettuce weight data and parameters for Experiment 1 and 2.
Taste-testing
Similar to Experiment 1, the lettuce was subjected to independent taste testing. On the day of harvest (Day 40), volunteers were asked to assign values from 0 to 10 based on overall appearance and taste. Appendix A shows the form that was filled out for each sample that was tested.
Figure 4 shows the results of the taste test analysis for both experiments. Based on the average score for each attribute, there was a clear difference between LED grown lettuce and fluorescent grown lettuce, even when the light intensity (Experiment 2) was identical.
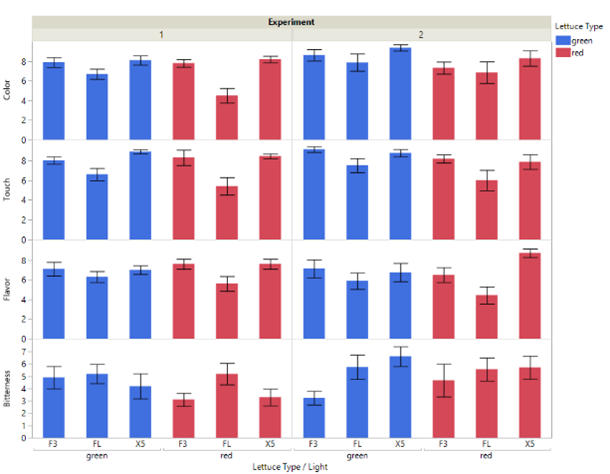
Figure 4 – Average scores for the taste-test portion of Experiment 1 and 2. Participants tested only red or only green, there was no crossing of lettuce types by any tester. Error bars represent the standard deviation, n=10 for each lettuce type.
For color and touch, the LEDs consistently ranked higher for both green and red lettuce varieties with more pronounced differences in Experiment 1. For the flavor component, there was more pronounced difference in red lettuce between the light treatments. The bitterness score changed significantly between the experiments. For Experiment 2 the F3 spectrum was the least bitter of the three treatments.
Discussion
The experiment introduced in this report (Experiment 2) showed that even under identical light intensities, the light quality provided by LED F3 and X5 spectrum resulted in greater growth and improved marketability for two Salanova lettuce types.
These results are useful for anyone considering LED lighting in controlled environmental agriculture. This data shows that not only are efficiencies of LED lighting 42% to 69% greater compared to fluorescent grow lights [3], but they also result in higher productivity.
Differences between the experiments for red lettuce (Figure 3) show that there is an increase from Experiment 1 to 2 for all light treatments. This is an indication that red lettuce prefers higher PPFD or DLI (which was slightly higher in Experiment 2 than in Experiment 1). The green lettuce in Experiment 1 grew best under X5 and second best under F3. In Experiment 2 it was the opposite, where green lettuce grew best under F3 and second best under X5. It should be noted that the lettuce types for green lettuce were different between the experiments. In Experiment 1, the Salanova green oakleaf was used while in Experiment 2, the Salanova green butter was used. It has been shown in the literature that even very related plant species react differently to light intensity and quality [5]. For this reason, it is difficult to compare the two experiments for the green lettuce in terms of treatment. It can be concluded, however, that the green oakleaf in Experiment 1 grew better than the green butter lettuce in Experiment 2. And also that the green butter performed better in F3, whereas the green oakleaf preferred the X5 spectrum.
Indoor vertical farmers have many lighting choices when it comes to horticulture lighting. This report shows data collected from two in-house experiments over a variety of conditions and concludes that using LEDs saves on operating cost while improving productivity. These are two very important considerations for indoor farming operations.
Abbreviations
PPFD, photosynthetic photon flux density
DLI, daily light integral
References
[1] Knight, Rebecca. “Increased Growth and Marketability of Two Lettuce Varieties Due to LED vs. Fluorescent Lighting.” http://illumitex.com/increased-growth-marketability-two-lettuce-varieties-due-led-vs-fluorescent-lighting-white-paper-772
[2] Knight, Rebecca. “Physiological Differences and Chlorophyll Content for Red and Green Lettuce Due to LED vs. Fluorescent Lighting.” http://illumitex.com/physiological-differences-chlorophyll-content-red-green-lettuce-due-led-vs-fluorescent-lighting-white-paper-773
[3] Illumitex Lettuce Growth and Taste Experiment
Part 1 (https://www.youtube.com/watch?v=spxi9Vl2fcs)
Part 2 (https://www.youtube.com/watch?v=QAlsjWtcuU0)
Part 3 (https://www.youtube.com/watch?v=5X7iJkV-BHc)
[4] Hernandez, Ricardo. Plant photomorphogenesis: The latest in LED research for sole-source lighting under closed-type growing conditions. Produce Grower. June, 2016. pp 46-49.
[5] Massa, Gioia, Hyeon-Hye Kim, Raymond Wheeler, Cary Mitchell. “Plant Productivity in Response to LED Lighting.” HortScience. 2008. 43(7):1951-1956.
APPENDIX A – Taste-test questionnaire