Experiments were conducted in a vertical growing system on two lettuce varieties (Red Oakleaf and Green Butter Salanova) under three different light treatments – fluorescent T5 light bars, Illumitex F3 LEDs, and Illumitex X5 LEDs. Environmental parameters and light-source wattages were identical for the three light treatments. Due to differences in light fixture efficiencies, the LED light sources produced up to 5.3 times the number of photons within the photosynthetically active radiation (PAR) wavelength range of 400-700nm. The growth of red and green lettuce under LEDs increased significantly over the fluorescent light, with the red lettuce increasing more (287-314%) than the green lettuce (173-219%). Blind taste-testing found LED grown lettuce to be preferred in terms of appearance and taste, and to be less bitter than the fluorescent grown lettuce. The results of this study suggest that on a watt-to-watt basis, growers using vertical farming systems growing lettuce are best served to use LED light sources over fluorescent light for improved biomass, productivity, and marketability.
Table of Contents
1. Introduction
2. Materials and Methods
3. Results
4. Discussion
5. References
1. Introduction
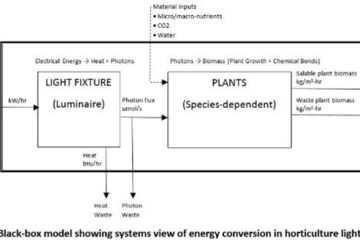
Indoor vertical farmers have many lighting choices when it comes to horticulture lighting. LEDs represent the most efficient means of providing photons but there is still debate on how the use of LEDs vs. legacy lighting affects growth and productivity of different plant species. The experimental set-up and results outlined in this report provide data in order to clarify the effects of different lighting types and spectrum delivery on growth and development of specific crop plants. This information will allow indoor farmers to take the first step in making a smart decision regarding LED lighting systems for specific applications.
2. Materials and Methods
Experimental System
- Photon grow-tent 4x4x8 ft3
- 4-tier metal shelving
- 3 x plastic tray (24x44x7) (Botanicare), fitted with grommets at base for flow in, fitted with grommets on front side away from in-flow (3” above base) for drain out
- 3 x small fans for air flow at each level
- 3 x insulation sheets (blue Dow styrofoam), each with 15 holes cut at 8” at center to center for raft
- Submersible pump
- 5 gallon bucket for reservoir
- Air pumps and air stones (2 for each trough, 1 for reservoir)
- Tubing for nutrient-rich water circulation and for air pumps
- Suction fan placed at top of tent to control humidity
Lighting
- Top shelf – T5 4 ft (120 cm) CW Fluorescent Light (JUMP START)
- Middle shelf – Eclipse ES2 F3 Spectrum Surexi (Illumitex)
- Bottom shelf – Eclipse ES2 X5 Spectrum Surexi (Illumitex)
Seeds and Consumables
- Johnny’s Salanova Lettuce Green Butter MT0 OG-pelleted seeds, 3056JP.64
- Johnny’s Salanova Lettuce Red Oakleaf MT0 OG-pelleted seeds, 3059JP.64
- Grow plugs (Ready Gro)
- 2” Net pots (National Garden Wholesale)
Methods
Seeds were germinated in plugs inside a humidity dome at 75 °F under an Eclipse ES1 F3 spectrum at 250 µmol/m2-s, at 24 hr light for 12 days before being transferred to the experimental set-up. The experimental set-up was a three-tiered, recirculated, gravity-feed, hydroponic, deep-raft system inside a grow tent with three different light treatments (one on each shelf). The intensity of the LED lights on the middle shelf (F3 spectrum) and bottom shelf (X5 spectrum) were adjusted until the electricity consumption (measured in Watts) matched the electrical consumption of the fluorescent lights (top shelf) using a Kill-o-Watt Meter.
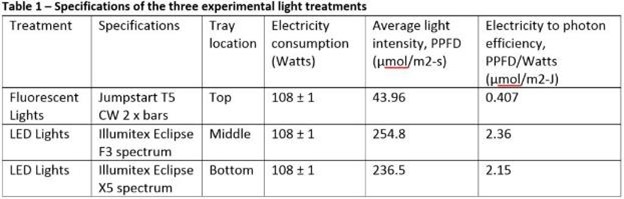
Table 1 displays the resulting electricity used by each light source, adjusted in order to match light output intensity for each treatment. Light intensity of each tray was determined by taking the average of 15 measurements at equal spacing over the tray surface (LI-250A Light Meter). The electricity to photon efficiency is the ratio of PPFD delivered to watts input, given in (µmol/m2-s)/W= µmol/m2-J. This value is calculated for each light treatment shown in Table 1. Based on the light intensity provided at the raft surface of each light treatment, the efficiency of photon production was 0.407, 2.15, and 2.36 µmol/m2-J for fluorescent, X5, and F3 LEDs, respectively. This is an improvement of 2.36/0.407=5.8 fold from fluorescent to F3 LEDs. In other words, 5.8 times as much photosynthetically active radiation (PAR, PPFD between 400-700 nm) was emitted with the F3 LED vs. the fluorescent lights using the same amount of electricity.
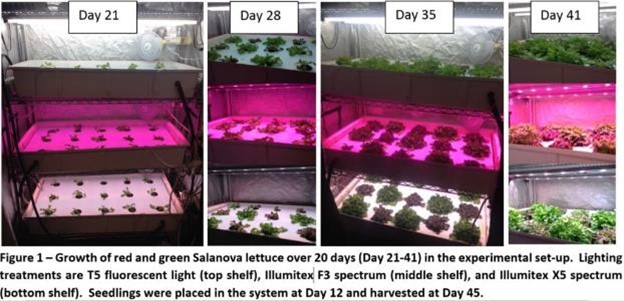
The lettuce seedlings were transferred on Day 12, placed in a net pot, and alternated between green and red lettuce varieties within each tray. Figure 1 shows the progress of plant growth in the system on select days from Day 21 to Day 41. The system conditions were checked every other day. At the start, filtered municipal water (GroGreen filter, HydroLogic) was blended with fertilizer (FloraDuo A&B, General Hydroponics) until the system reached 800 ppm. The approximate volume of water in the system was 45 gallons. A biological inoculant (SOS, Micro-TES) was used at the beginning of each cycle at the recommended dosage (2 tsp per gallon). The average temperature was 72.2 ± 1.3 °F and humidity 40.8 ± 4 % (AcuRite 00613A1 Indoor Humidity Monitor).
On the day of harvest, several of the weighed samples were then removed and taken for laboratory analysis. The following video shows the system right after the representative samples were removed on the day of harvest:
3. Results
Light Comparisons
The spectrums of the three light treatments were scanned using an Ocean Optics USB4000 with OceanView software. In order to determine if there was light pollution between the light treatments, the tip of the fiber optic was held at the front of the tray system in-between the light source and the canopy. Figure 2 shows the measured spectrums of the three light treatments showing no light pollution between light treatments.
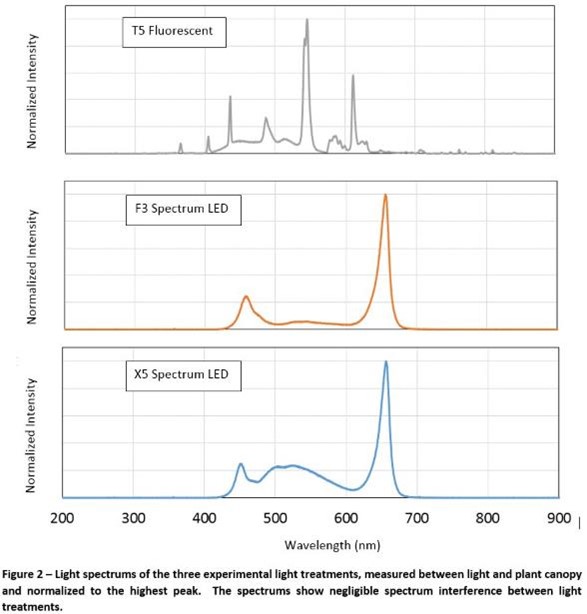
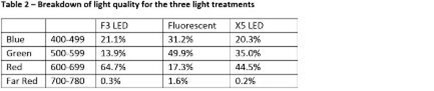
Table 2 is a breakdown of the photon light quality by 100 nm ranges of light color. The F3 spectrum has the highest percentage of red light. Fluorescent is almost 50% green light. The X5 spectrum is the most spread out of the three spectrums in terms of photon percentages.
Growth
The red and green Salanova lettuce varieties were alternated within the trays so that the fluorescent and X5 trays had 8 green and 7 red and the F3 had 7 green and 8 red. In each treatment, one red lettuce either did not grow or grew very poorly and was taken out. This left the count to 8 green and 6 red for fluorescent and X5, and 7 green and 7 red for F3, Table 3.
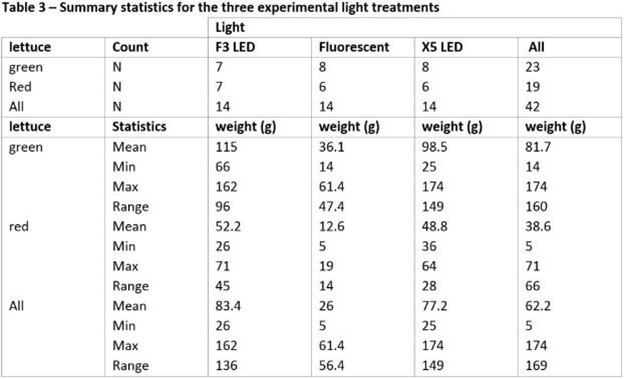
Table 3 also lists the final weights for the green and red lettuce under all three light treatments. Overall, the green lettuce was larger than the red lettuce under all lighting treatments. Green was an average of 81.7 g and red averaged 38.6 g. In terms of lighting treatments, the F3 spectrum LEDs outperformed the X5 spectrum LEDs with 83.4 g and 77.2 g, respectively. The fluorescent lights resulted in the least amount of growth at an average of 26 g.
Figure 3 is a graph showing the weights of each lettuce type under the different treatments. Clearly the LED treatments outperformed the fluorescent light treatments. The percentage increase in average weights for F3 LED and X5 LED treatments based on average Fluorescent weights are shown in the inset of Figure 3.
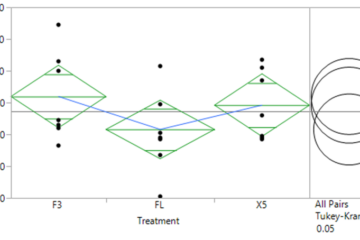
JMP 12 was used to statistically compare the data by lettuce varieties and treatment types. The top graph in Figure 4 is a comparison of the two lettuce types (regardless of treatment) and the bottom graph is a comparison of the three treatments (regardless of lettuce type). These graphs show lines tracing the means and a box plot of the data showing the distribution of the data. The box plot center line is where 50% of the data is below and above. The edges of the box show where 25% of the data is below or above. Maximum and minimums of the data are also shown.
The variance in a group of data is a function of how different the values in that group are away from the mean. Comparing the variance between two types of data indicates whether or not those data sets are statistically different or not. In Figure 4 the Tukey-Kramer plots are shown indicating the comparison of the variance between the two groups of data using a significance factor (alpha) of 0.05. The more separate the circles, the more statistically different they are. In Figure 4, there is a statistical difference between green and red lettuce varieties (the green grew bigger). There is also a statistical difference between the LED lighting results and the fluorescent light treatment. Between the LED lights, the F3 resulted in higher weight yet the variance between LED treatments is not statistically significant.
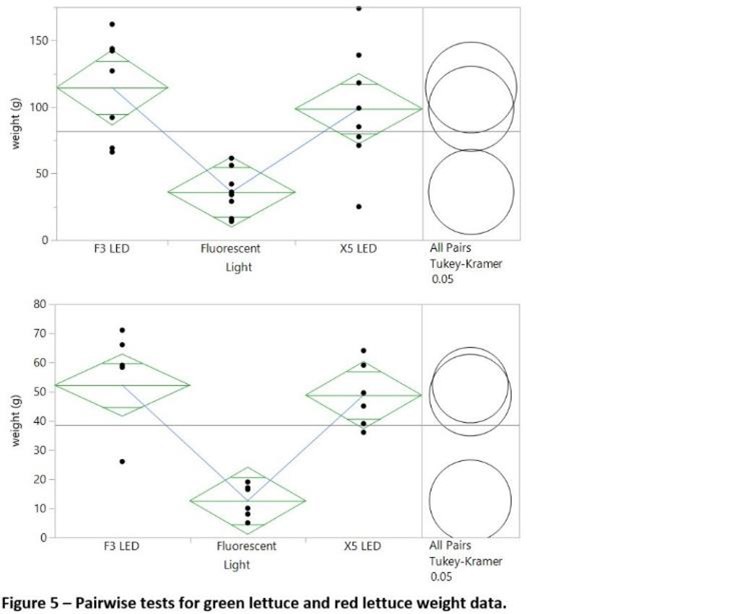
To check the effects of light treatment within each type of lettuce, the same comparison of variance was conducted for separate green and red lettuce data sets, Figure 5. The green triangle around the data indicates the Analysis of Variance (known as ANOVA). If there is horizontal separation between one group and another group (no overlap between green triangles), then the data is statistically different. This is also represented with the circles shown on the right hand side of the graphs.
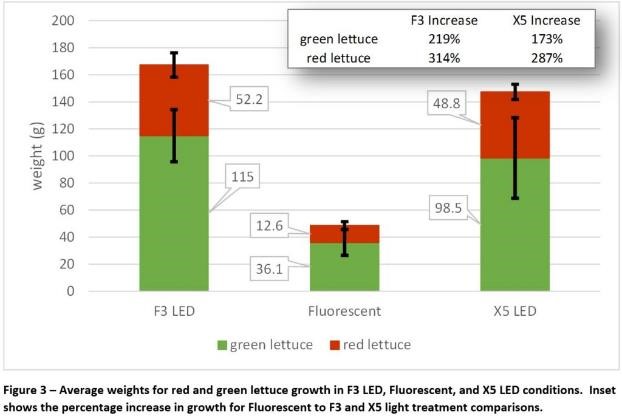
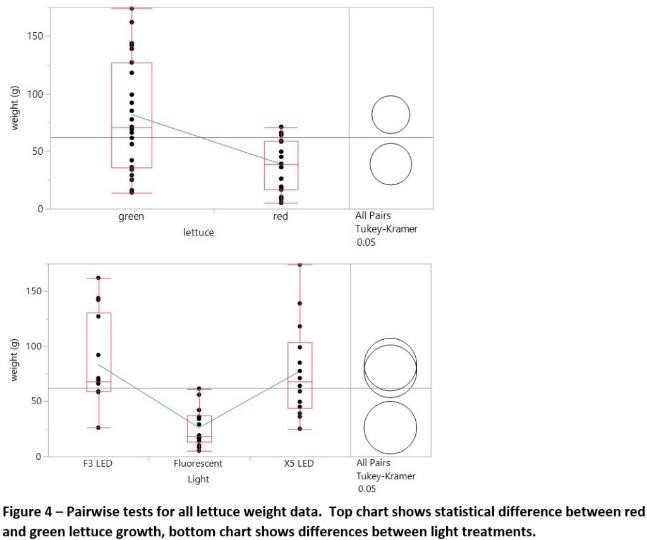
Figure 5 shows that for the green lettuce variety, the F3 LED was more statistically different from the fluorescents than the X5 LED but that they were not statistically different from each other. The red lettuce performed similar under the F3 and X5 LED treatments but both were statistically different than the fluorescent lights.
Visual Differences and Taste-testing
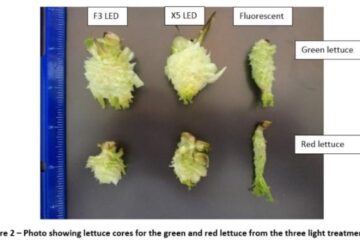
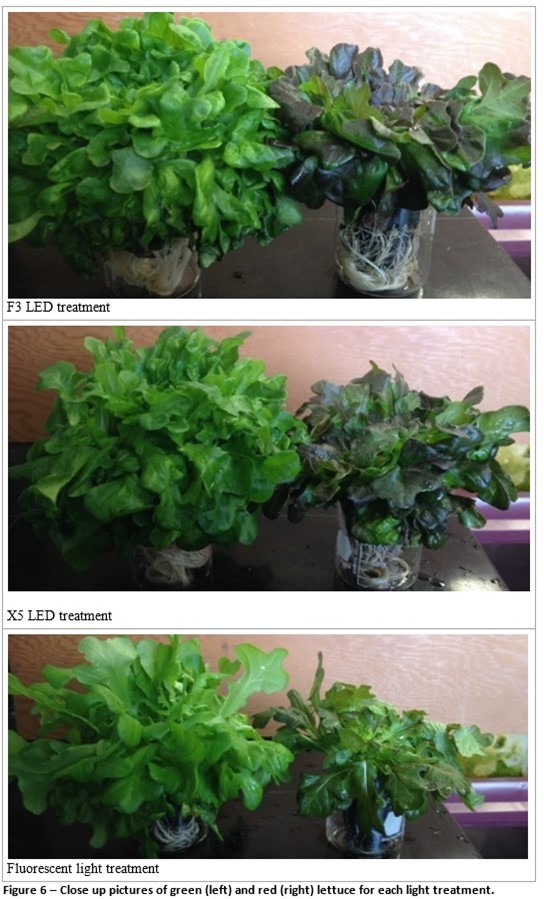
Both green and red lettuces had thicker and wider leaf structure under LED treatments than fluorescent treatment. Additionally, the red lettuce turned a deeper red under LEDs than fluorescent. This can be seen in Figure 6 which included photos of representative samples from each treatment.
Taste-testing was conducted in-house by volunteers over the course of one workday within hours of harvesting the lettuce. Each participant was given a random number which correlated to either red or green lettuce varieties with each of the three light treatment-grown lettuces, with the three treatments randomly given labels 1, 2, or 3. The numbers corresponding to different treatments changed throughout the day. The participants filled out a questionnaire and were encouraged to leave descriptive comments.
Figure 7 shows the results of the taste test analysis. Based on the average score for each attribute, there was a clear difference between LED grown lettuce and fluorescent grown lettuce.
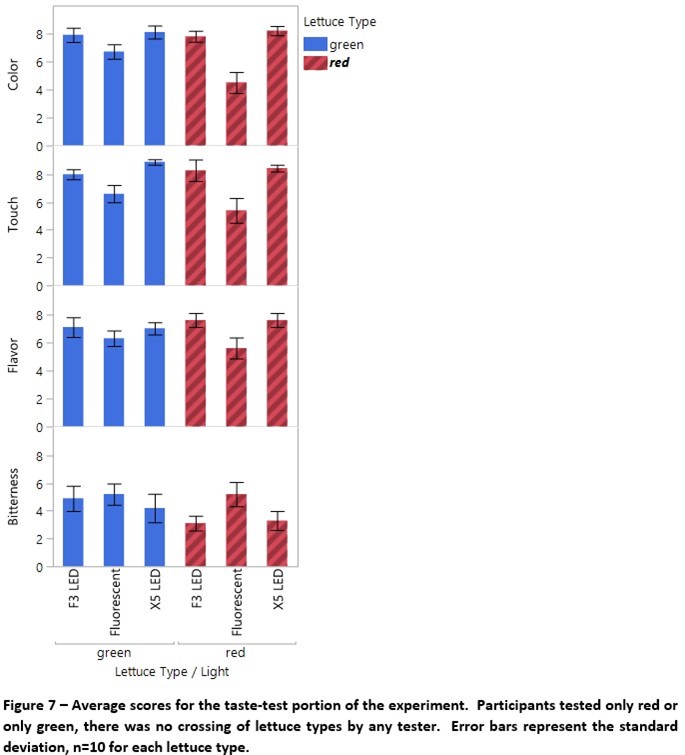
For color and touch, the LEDs consistently ranked higher for both green and red lettuce varieties. For the flavor component, the light treatments scored similar for green lettuce yet ranked higher in the red lettuce for LED lights. The bitterness was also close in the green lettuce but showed a difference in the red lettuce with the fluorescent lights scoring highest in bitterness.
4. Discussion
This experiment outlined the impact in growth of two lettuce varieties due to differences in lighting conditions. The three light sources (fluorescent T5 bulbs, Illumitex F3 LED, Illumitex X5 LED) were matched to use the same amount of wattage. With all other environmental parameters equal, the lettuce grown under LED lights was larger, more colorful, and had a higher marketability than the lettuce grown under fluorescent lights.
The fluorescent lights led to lettuce that weighed less and had leaves that were more fragile, spindly, and narrower than their LED-grown lettuce counterparts. Also, the red lettuce had less red pigment in the fluorescent treatment. The difference in morphology can be traced to one or both of the following; less overall photon flux or differences in light quality (spectrum). Since the fluorescent lights are less efficient than LED, matching their wattage led to a decrease in PPFD (in addition to the differences in the spectrums).
Several studies on lettuce have found that certain wavelengths affect lettuce growth differently. Johkan et al. tested the effects of only red, only blue, both red and blue, and fluorescent light on red lettuce seedlings under PPFD for each treatment of 100 µmol/m2-s. The study found that after 17 days of treatment, the red light resulted in the highest fresh lettuce weight and the red and blue resulted in the highest dry weight. Interestingly, those treated with red and blue had the highest biomass at time of harvest. The plants that received fluorescent light as seedlings performed poorly compared to the other light treatments. These results suggest that light quality does have an impact on lettuce growth and the treatments seedlings are exposed to can affect growth further along in plant development. Using a statistical model of different wavelengths, researchers in another study (Kong et al.) considered the effects of smaller ranges of light wavelength towards fresh biomass on Boston lettuce. The results of their findings found that green light promoted growth of Boston lettuce, but only if it was within 525 to 575 nm, and that over 30% green was non-beneficial. Additionally, these researchers found that 575 to 625 nm had little effect.
The pigmentation of the red lettuce is due to the secondary metabolite anthocyanin. Additional anthocyanin in the leaves are useful for marketing purposes because it is a known antioxidant and it adds to the attractiveness of lettuce leaves. This pigment is known to be further expressed as light intensity is increased. Massa et al. showed that the anthocyanin increased 2.5 fold from low light (225 µmol/m2-s) to high light (420 µmol/m2-s) treatments under the same spectrum (light quality). Due to photon flux being directly related to photosynthesis and the synthesis of certain secondary metabolites, it is a very important parameter; its effects should be treated separately from light quality.
In conclusion, the comparison of fluorescent to LED light spectrums outlined the differences in fixture efficiencies and productivity for two lettuce varieties in a vertical growing system. Visual and taste comparisons resulted in the LED-grown lettuce having higher marketability. Further research is needed to determine the effects of smaller ranges of wavelength. Future experiments aim to uncouple the PPFD from light quality. These types of experiments are only possible with LED technology. With increasing wavelength knowledge and LED optics technology at the forefront, we can expect to see great improvements in crop cultivation efficiencies in the near future.
5. References
- Johkan et al. Blue Light-emitting Diode Light Irradiation of Seedlings Improves Seedling Quality and Growth after Transplanting in Red Leaf Lettuce. HortScience December 2010 vol. 45 no. 12 1809-1814.
- Kong et al. The Contribution of Different Spectral Sections to Increase Fresh Weight of Boston Lettuce. HortScience July 2015 vol. 50 no. 7 1006-1010.
- Massa et al. Light-emitting Diode Light Transmission through Leaf Tissue of Seven Different Crops. HortScience March 2015 vol. 50 no. 3 501-506.
- Illumitex Lighting Experiment: https://www.youtube.com/watch?v=z4oqne0_5v0